Master Reports
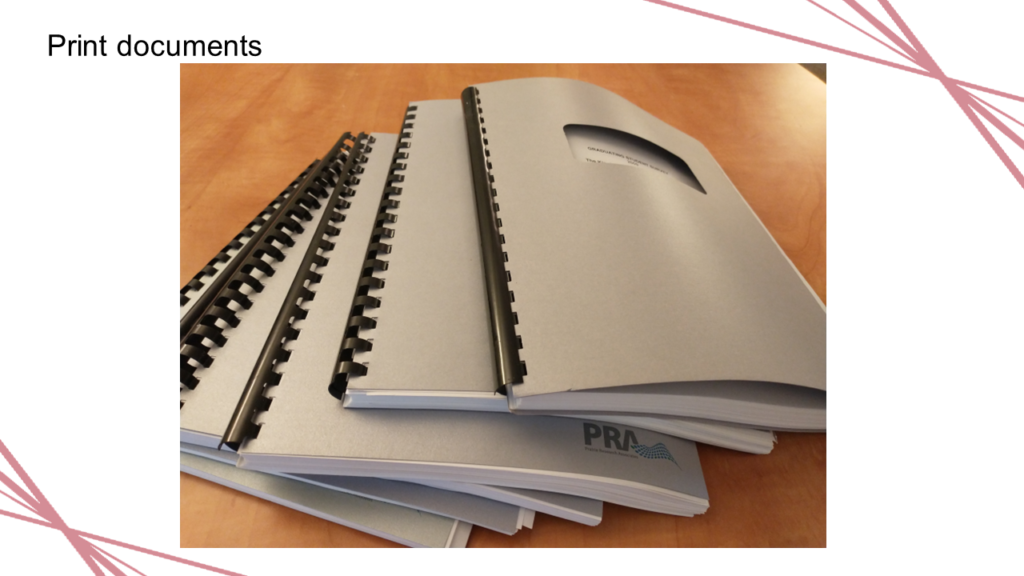
THWACK! When I first started the King’s Institutional Research Office that was the sound I heard when the prior coordinator of our CUSC participation dropped the reports on my desk with a resounding crash. You can still get printed documents, but these are now delivered in PDF format – a quieter and more compact format!

Quick Facts PowerPoint
One of those ways is through our Quick Facts PowerPoints. These give you comparisons between your institution and the national results or your institution group. These slides are easily copied and reordered to suit whatever reporting context you need.
Notes provide you data details, so you have those at hand when presenting.

Tables in Word
You also get your data tables from your master report in Word format. Again, this make selecting significant data to present to key stakeholders fairly quick and easy.

Tables in Excel
There are also Excel versions of your tables provided. You have the flexibility of Excel formatting and you add your own charts.

Tableau Workbook and DataSource
Institutions also receive multi-year CUSC data in a Tableau Workbook. This allows presentation flexibility but also doing roll-your own data comparisons.
You also have the Tableau Saved Datasource, so if you don’t like our Workbooks, you can build your own.

SPSS Data
CUSC data is also delivered in SPSS format. You can use SPSS to do more statistical analysis on your own or the national data sets.
The audience is listening
Crosswalk TableAdmissionsFirst Year ProgramsStudent ServicesAcademic Accommodations, Student Mental Health RetentionTeaching and Learning CentreAcademic Program Reviews…
Converting CUSC-CCREU data to Analysis Friendly (especially Tableau) tables
What you get out of it depends on what you put into it You should…
How CUSC data is shared
Master Reports THWACK! When I first started the King’s Institutional Research Office that was the…
Making your CUSC data earn its keep
Perhaps you are like my institution – you have participated in CUSC surveys for a…
